

One of the popular reasons for using Kotlin Coroutines is to limit the number of threads used in your application. Each thread is a cost, especially in memory, but also in CPU attention. We introduce coroutines to limit the number of threads used in our applications. In the end, with coroutines, we can achieve concurrency without unnecessary threads. However, our efforts are often sabotaged by libraries we use. In this article, I present how many threads the most popular network clients use, and how you can check it yourself.
Let's start from understanding the problem, and what would be the perfect solution. Imagine that you implement a simple application that serves as a gateway. For each request it receives, it makes a request to another service. This is a common situation, especially in microservices architecture. If you start each request in a new thread, and block this thread until the response is received, you will end up with many active threads. That is a problem, because each thread consumes memory. The amount of memory is typically around 1 MB of RAM per thread. Now imagine that you have 10,000 requests per second, and each request takes 100 ms, that would mean that you need on average 1000 threads for just blocking them when they wait for responses. That is assuming a perfect case, where you have constant number of requests, what if at one time you will have an exceptionally high load? Notice that if you do not have enough RAM, your application will have an exception, and it will crash (unless you limit this pool size, but then you will have a bottleneck).
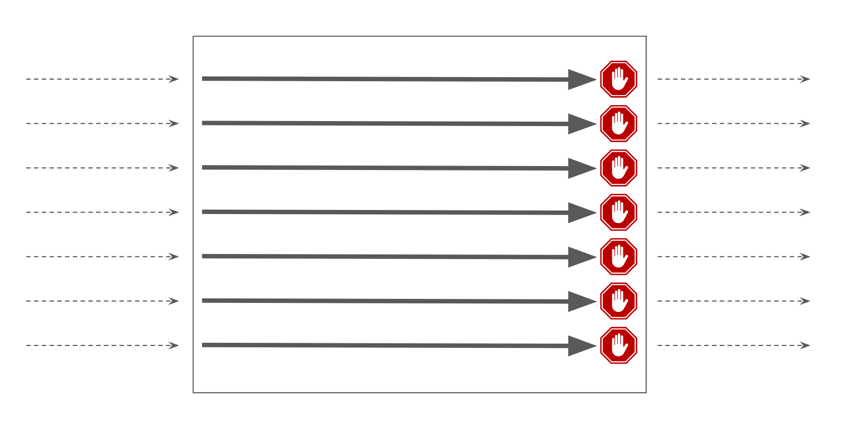
Spring Boot application, were requests run on threads, that are blocked when they wait for response from network.
One way to deal with this problem is using coroutines. Coroutines are processes that can be suspended, and a suspended coroutine does not consume any memory (only references to local variables, required to resume this coroutine). So when you use Ktor or Spring Boot with support for coroutines, every request is started in a coroutine, that is lightweight, and we expect that when we make a network request, this coroutine will be suspended, and it will not consume any memory.
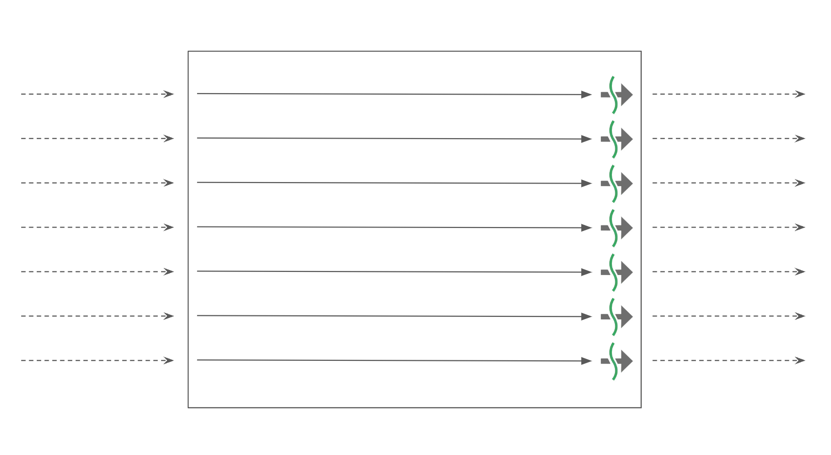
Ktor Client or Spring Boot application, were requests run on coroutines, that are suspended when they wait for response from network.
That would mean we would eliminate the cost of unused threads. That is perfect, but there is a catch: not all libraries work as expected. Many libraries suspend coroutines, but under the hood keep a dispatcher with a pool of threads that they block when they wait for a response. That means the advantage of using coroutines is nearly lost. A good example of such a library is Retrofit.
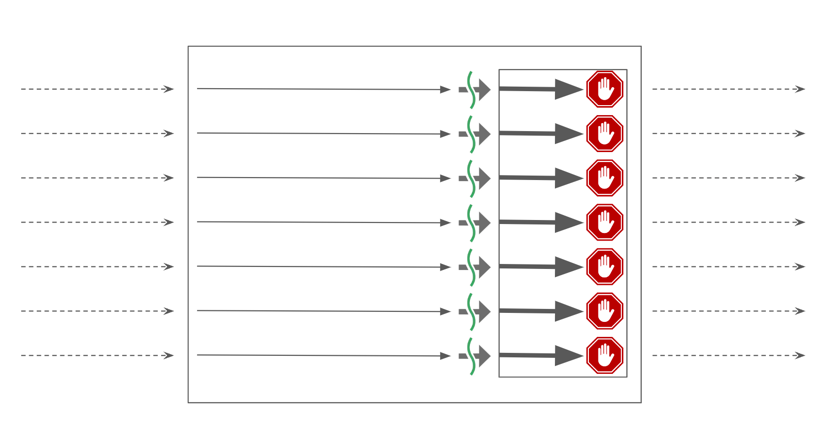
Ktor Client or Spring Boot application, were requests run on coroutines, that are suspended when they wait for response from network, but where an network client (like Retrofit) that blocks threads under the hood is used.
Why do such libraries behave this way? The reason is that they are built on top of libraries or old Java API that do not support suspending operations. Retrofit is built on top of OkHttp, which is built on top of old Java API, that provides blocking functions. That means that Retrofit can suspend coroutines, but under the hood, it must block. The number of blocked threads is the number of active network requests. That means coroutines can still be beneficial for this application (the number of active network requests is often limited), but it is not as beneficial as we might expect.
So without further ado, let's check how many threads are used by the most popular network clients. Then I will explain my methodology, and leave you with reflections on how to choose a network client for your application.
I will compare three popular Kotlin network clients: Retrofit, Ktor Client, and Fuel. Ktor Client allows you to choose an engine that you want to use to make network requests. I will compare all available JVM engines that I could start without Android, and where I could set custom limit of active connections.
The most important conclusion from my experiments is that Retrofit, Fuel and Ktor Client with OkHttp engine all block as many threads under the hood as there are active requests. All the other Ktor Client engines used only a few threads for maintenance.
Here is an example result of my experiments, where measurement was made for 100 requests that all waited for response 2 seconds, and each client was configured to handle 100 requests at the same time:
| Client | Number of active threads | Execution time |
|---|---|---|
| Retrofit | 101 | 2264 +/- 300 |
| Ktor OkHttp | 101 | 2317 +/- 300 |
| Ktor Apache | 5 | 2215 +/- 300 |
| Ktor Apache5 | 4 | 2198 +/- 300 |
| Ktor Java | 1 | 2218 +/- 300 |
| Ktor CIO | 1 | 2242 +/- 300 |
| Fuel | 101 | 2312 +/- 300 |
+- 300 is added to clarify that time is not precise, I added it to remind you to not look at those numbers too precisely, you can assume they all take around 2 seconds to execute, but the exact number might vary. Tests were making real network requests, and the time of response could vary.
If you take a look at the results, it is quite clear that Retrofit, Ktor with OkHttp engine, and Fuel take much more threads, that is always the number of active connections plus 1. Ktor with Apache, Apache5, Java, and CIO engines constant number of threads, no matter how many requests are active. This means they are well implemented. The number of threads cannot be 0, because there must be a thread that waits for responses, but in Ktor CIO and Ktor Java it is the only one that is used.
Looking at those results, CIO might look like a perfect engine. Apparently, I observed that its efficiency drops down with a greater number of active connections. Also Ktor Apache sometimes has much longer execution time. I am not sure why is that, but I reported that as issues. For other engines, the differences in execution time are not significant. Those are results for 1000 requests and 2 seconds of response time:
| Client | Number of active threads (500 requests) | Execution time (average) |
|---|---|---|
| Retrofit | 501 | 2619 +/- 300 |
| Ktor OkHttp | 501 | 2425 +/- 300 |
| Ktor Apache | 5 | 4725 (3000 - 10000) |
| Ktor Apache5 | 4 | 2624 +/- 300 |
| Ktor Java | 1 | 2511 +/- 300 |
| Ktor CIO | 1 | 11118 +/- 300 |
| Fuel | 501 | 2585 +/- 300 |
After all those experiments, I consider Ktor Client with either Java or Apache5 engine most efficient. They are also very well-featured, and seem like great choices for most applications.
However, in those experiments I tested a particular situation, where we make a big number of requests, and each of them is delayed. That situation relates well to some backend applications, but not to all of them.
It does not relate well to applications that make a small number of requests, but each of them has a lot of data to receive. It also does not relate well to the situation, where a lot of requests are made, but each of them is very fast (like when they communicate via localhost or via local cable). In such situations, it is possible that Retrofit outperforms Ktor with Java or Apache 5 engines. To test that, we would need to construct a different experiment. If you want me to make a raport that overviews all aspects of network clients, let me know on Twitter or in the comments below.
Also, in many applications, we respect developers' convenience beyond performance. In such cases, Retrofit might be preferred if developers are already familiar with it, and it is quite convenient to use.
Choosing the best network client is not an easy task, here I only presented one aspect of this decision: how many threads are used by a network client.
I made a couple of experiments, but the one I want to concentrate on has the following characteristics:
- Makes n requests on different asynchronous coroutines.
- Each request is a real call to a real server, the server is configured to respond after the specified number of seconds.
- After 1 second, this test check how many threads are active.
- The test cleans all started threads after each run.
- Test repeats for all clients 10 times in random order. After those experiments, averages are counted. There is also a warmup phase before experiments.
- Tests have many internal checks, for instance, they check that after one second all requests are started but none of them is finished. They also track threads, to make sure those threads are correctly cleaned after each test.
- All tests wait until all requests are finished, and store the time it took.
Complete code can be found in this project:
Complete test code can be found here:
Complete clients configurations:
This is what an example client configuration looks like:
object RetrofitClient : ClientToTest {
    override val name: String = "Retrofit"
    var dispatcher: Dispatcher? = null
    var apiService: ApiService? = null
    var client: OkHttpClient? = null

    override fun start(requestsToStart: Int) {
        dispatcher = Dispatcher().apply {
            maxRequests = requestsToStart
            maxRequestsPerHost = requestsToStart
        }
        client = OkHttpClient.Builder().dispatcher(dispatcher!!).build()
        val retrofit: Retrofit = Retrofit.Builder()
            .client(client!!)
            .baseUrl("https://api.kt.academy/")
            .addConverterFactory(ScalarsConverterFactory.create())
            .build()
        apiService = retrofit.create(ApiService::class.java)
    }

    interface ApiService {
        @GET("delay")
        suspend fun getDelayedResponse(@Query("delay") seconds: Int, @Query("a") a: Int): String
    }

    override suspend fun request(seconds: Int, a: Int) {
        apiService!!.getDelayedResponse(seconds, a)
    }

    override fun close() {
        interruptOkHttpThreads(dispatcher!!, client!!)
        dispatcher = null
        apiService = null
        client = null
    }
}
A simplified version of this experiment looks as follows:
fun main(): Unit = runBlocking {
    val threadsActiveBefore = Thread.getAllStackTraces().keys.filter { it.isActive() }.toSet()
    for (client in clients) {
        testClient(client, threadsActiveBefore)
    }
}

suspend fun testClient(client: ClientToTest, threadsActiveBefore: Set<Thread>) {
    val requestsToStart = 500
    val responseTime = 4000L
    client.start(requestsToStart)
    val activeUparkedNew: Int
    measureTime {
        coroutineScope {
            repeat(requestsToStart) {
                launch {
                    client.request(responseTime, it)
                }
            }
            delay(1000)
            activeUparkedNew = Thread.getAllStackTraces().keys.filter { it.isActiveUnparked() && it !in threadsActiveBefore }.size
        }
    }.let {
        println("For client ${client.name} active and unparked threads: $activeUparkedNew, time: ${it.inWholeSeconds} sec")
    }
    client.close()
    restartCoroutineDispatchers()
    forceGC()
}

fun Thread.isActiveUnparked() = isAlive && !isInterrupted && stackTrace.firstOrNull()?.methodName != "park"
As you can see, we measure here how many active threads there are in the middle of requests, and what is overall execution time. In the complete test, I also measure other metrics, but primary to make sure that the test is correct. Here is what an example result might look like for 500 requests and 2 seconds of response time (of the complete version, with more metrics):
Client         ActiveUnparkedNew   ActiveUnparked      ActiveNew      Active         All            Time           Threads before
Retrofit:      501                 508                 506            513            513            2442           7 -> 7
Ktor OkHttp:   501                 508                 552            559            559            2428           7 -> 7
Ktor Java:     1                   8                   100            107            107            2687           7 -> 8              New threads: [Thread[HttpClient-1-SelectorManager,5,main]]
Ktor Apache:   5                   12                  76             83             83             2558           7 -> 7
Ktor Apache5:  4                   12                  110            118            118            2583           8 -> 7
Ktor CIO:      1                   8                   85             92             92             11411          7 -> 7
Fuel:          501                 508                 516            523            523            2357           7 -> 7
The most important metric for me is
ActiveUnparkedNew, all the other metrics are just for validation, to make sure that the test is correct, and to track unexpected behavior, like uncleaned tests or longer execution time.Why am I most interested in threads that are not parked (
stackTrace.firstOrNull()?.methodName == "park")? The threads in the park state are threads that are in Kotlin Coroutines dispatchers that are not used. Apparently, Ktor Client uses this dispatcher to start requests. Once requests are sent, those threads are parked, so they can be used by other processes. That is why we should not count them. It is not a perfect solution, because a limited number of threads is needed to start requests, but this is probably the best solution we can get.To prove that
Dispatchers.IO threads are available, you can uncomment the code in test, that starts a big number of coroutines whose only task is to block IO dispatcher. You will see that adding that does not significantly increase the number of threads and does not significantly increase execution time, even though its expected execution time is similar to the execution time of requests. That means both are executed in parallel, and threads that were parked can be used while requests are waiting for responses.// Add inside coroutineScope after starting requests
delay(500)
repeat(150 * 64) {
launch(Dispatchers.IO) {
Thread.sleep(10)
}
}
If you do not filter out parked threads, you can still see the difference between Retrofit and Ktor Client, but the picture is less clear due to all the threads that were started just for a moment, and then parked. This is how an example results look like when we do not filter out parked threads:
Client         ActiveUnparkedNew   ActiveUnparked      ActiveNew      Active         All            Time           Threads before
Ktor OkHttp:   501                 508                 581            588            588            3038           7 -> 7
Ktor Apache:   5                   12                  41             48             48             5057           7 -> 7
Ktor Apache5:  4                   11                  109            116            116            2830           7 -> 7
Fuel:          501                 509                 516            523            523            3900           7 -> 7
Ktor CIO:      1                   8                   89             96             96             11310          7 -> 7
Ktor Java:     1                   8                   91             98             98             3144           7 -> 8              New threads: [Thread[HttpClient-2-SelectorManager,5,main]]
Retrofit:      501                 509                 516            524            524            3253           8 -> 7
Parallel tasks have a huge impact over the number of unparked threads (obviously), but a small one on the number of active threads. That shows that those threads are not used, and can be considered as not active. But even if you measure all threads, the difference between Retrofit and Ktor Client is still significant, only the picture is less clear.
I made sure that my clients do not leave any active thread after their measurement. I also clear dispatchers used by Kotlin Coroutines. To check this out, I track threads that are active before and after each test. Tests are repeated 10 times, they have warmup, and averages are calculated from test runs.
If you see anything wrong with my measurements, let me know (marcinmoskala(at)gmail.com), I will be happy to correct them.
At the moment, I do not have access to an application big enough to visibly show differences between network clients. So I contacted friends of mine to ask them to run experiments on their production applications.
One of them was a Voluum team from Commerce Media Tech. It is Vacuum team who actually recognized the problem with Retrofit, and inspired me to make those experiments. They replaced Retrofit with Ktor Client with Java in one of the modules of their application. Apparently, the improvement was not significant enough to make it visible, it was only one module out of 30 in this application.
If you plan to make such an experiment, I will be very grateful if you can share your results with me, I will be happy to publish them here, and announce them on Twitter.
In applications that need to make a big number of requests, and each of them is delayed, Ktor Client with Java or Apache5 engine seems to be the best choice. It is also very well-featured, and seems like a great choice for most applications. However, in many applications, we respect developers' convenience beyond performance. In such cases, Retrofit might be preferred if developers are already familiar with it, and it is quite convenient to use. Consider that those experiments matter little in projects that can use Java 21 and virtual threads from Project Loom. Using Retrofit, there might be a good choice (assuming it is configured to use virtual threads). We also need to rest for other kinds of situations, like where we have a small number of requests, but each of them has a lot of data to receive. Do not forget to test and measure your application in production, that should be the most important source of information.
